Connect: Airbyte Source and Target Framework

1. Project Overview
Product: Connect
Industry: Data Integration and Management
My Role: UX Manager & Architect
Team:
Project Manager
Technical Architect
UX Designer
UX Manager & Architect (myself)
Timeline: Project initiated in 2022, launched early 2023
2. Business Challenge
Pain Points
Data silos making integration slow, requiring specialized skills, and difficult to scale
Lack of quick configuration options for connecting disparate data sources to target systems
Need for improved management of scheduled replication pipelines
Business Objectives
Enable quick configuration of pipelines connecting disparate data sources to target systems
Facilitate data integration for new applications, analytics, and machine learning
Improve user experience for managing and configuring scheduled replication pipelines
Prepare for future extension of pipelines to run within customer environments
Key Stakeholders
Business Analysts (Javier Ramirez)
Data Analysts (Janet Stivick)
Systems Engineers (Eddie Skinner)
Professional Services (Brian Doud)
Support Representatives (Lucy Ramos)
Precisely Product Management
Development Team
3. Process and Methodology
Research
Conducted discovery and initial research session with the UX team
Analyzed current UI and user journeys
Studied concepts and relationships in data integration processes
Design Thinking Approach
Empathize: Identified user personas and their specific goals/tasks
Define: Clearly outlined pain points and project goals
Ideate: Brainstormed solutions during UX architecture planning
Prototype: Created wireframes and high-fidelity designs
Test: Conducted internal testing and user feedback sessions
Project Timeline
Stage One: Discovery & Initial Research
Stage Two: Wireframe Creation
Stage Three: Detailed Designs
Stage Four: Development and Live Launch
4. Design Evolution
Initial Concepts
Created journey maps for the setup wizard and pipeline creation process
Developed initial wireframes using Mural for internal testing
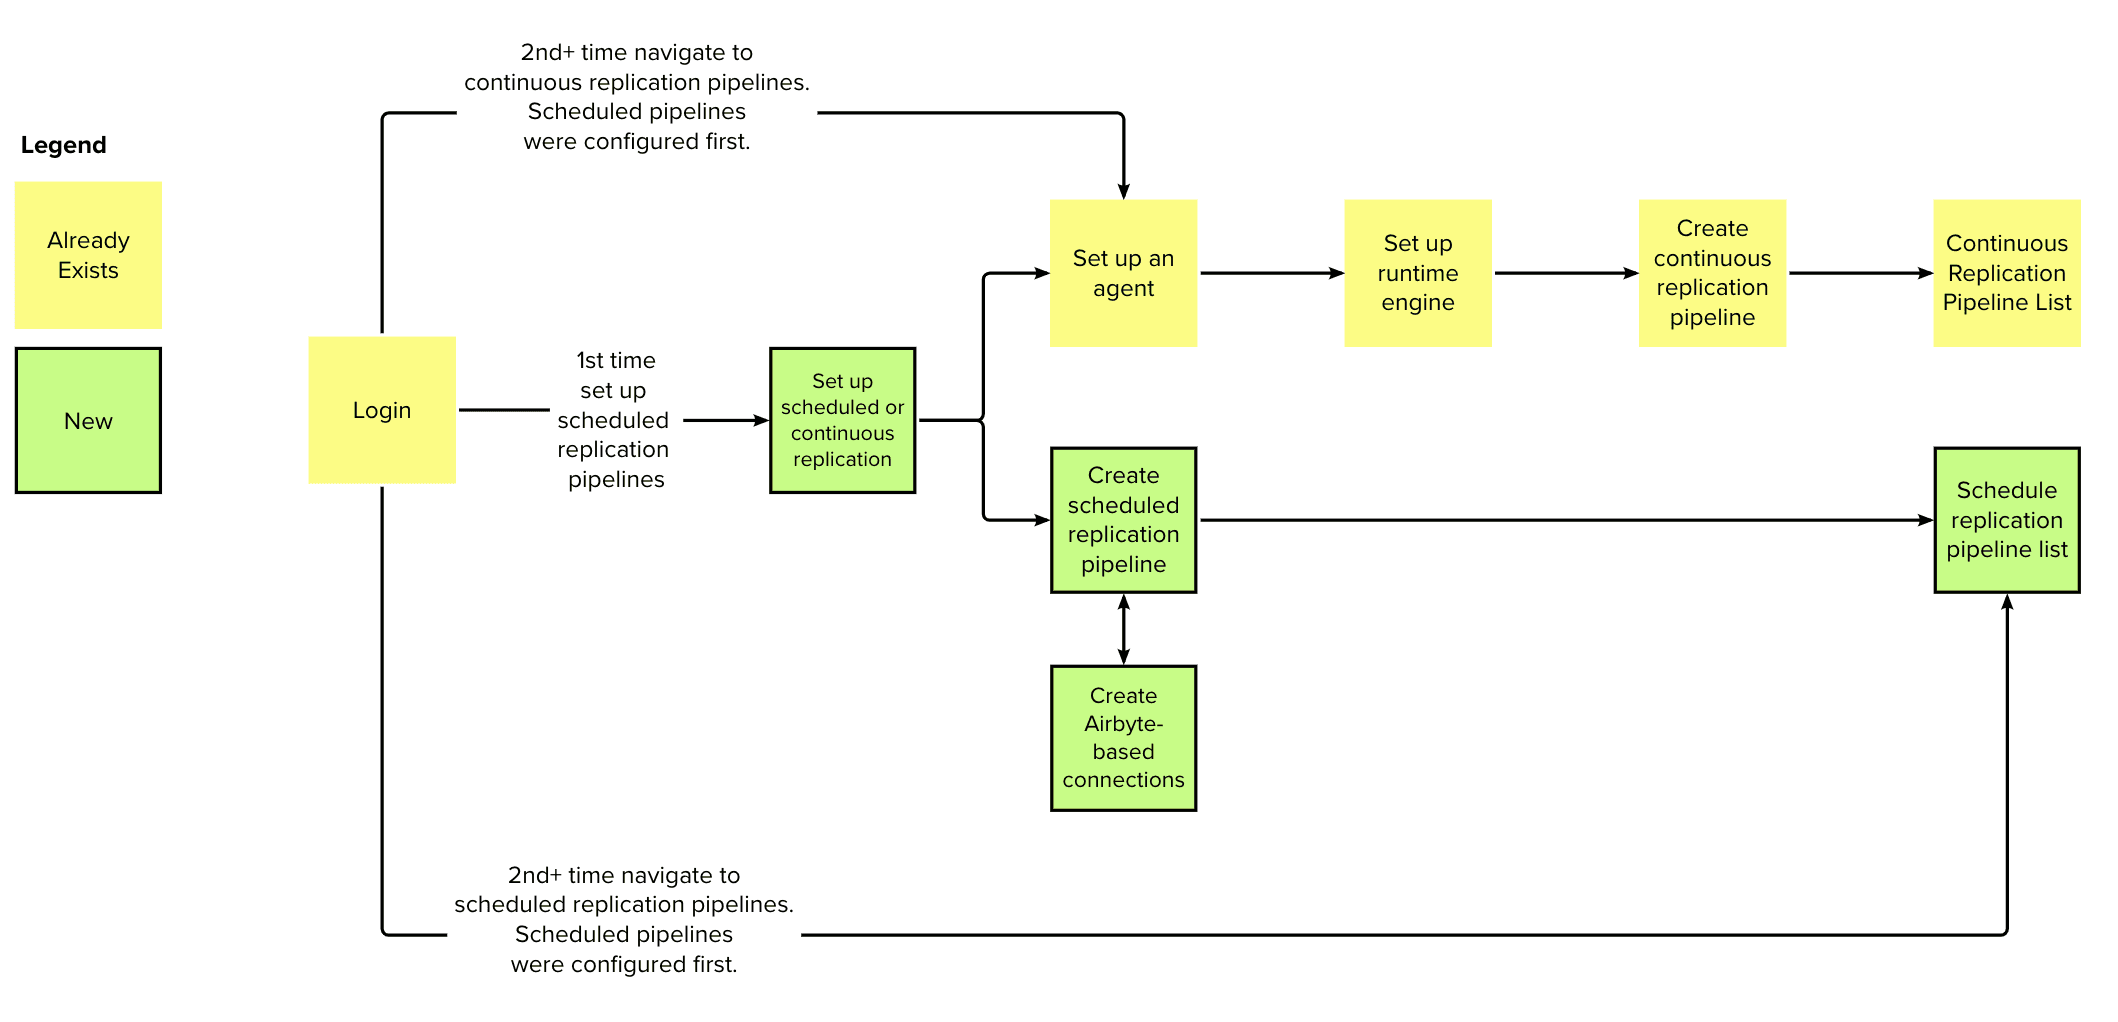
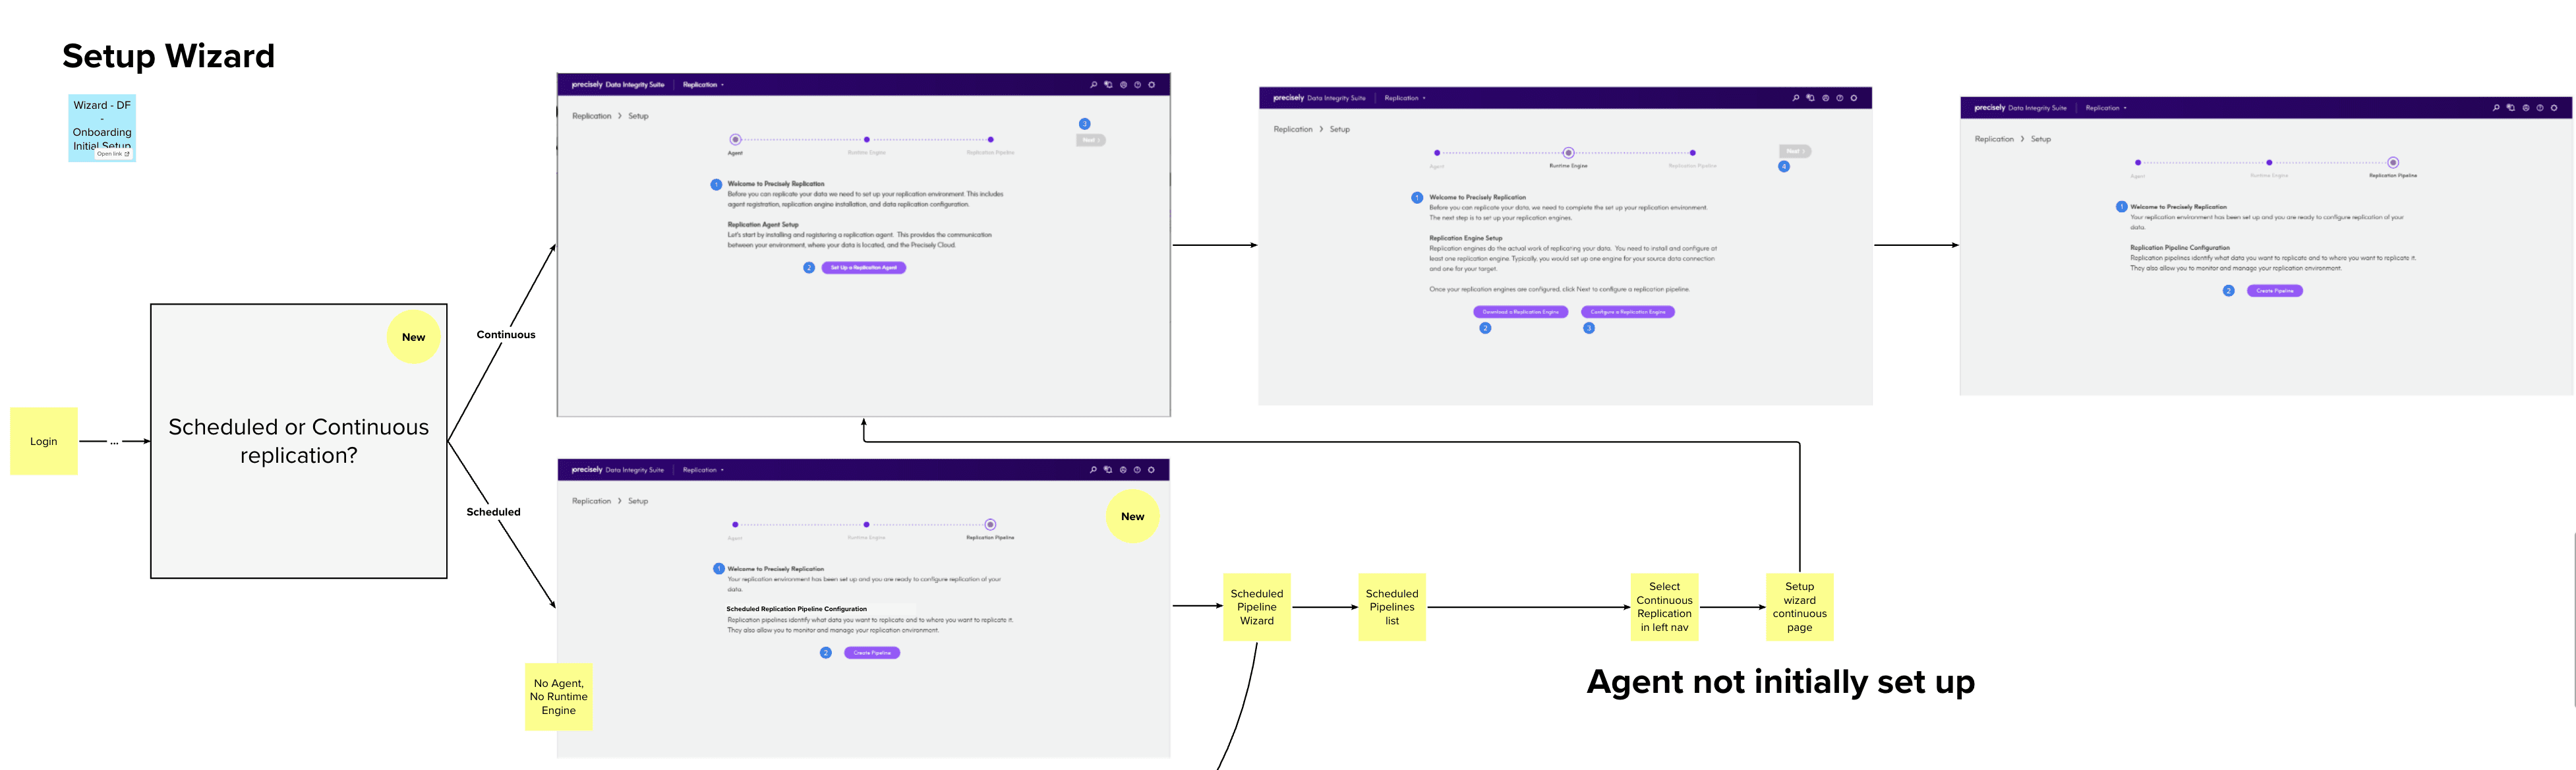
Journey Mapping
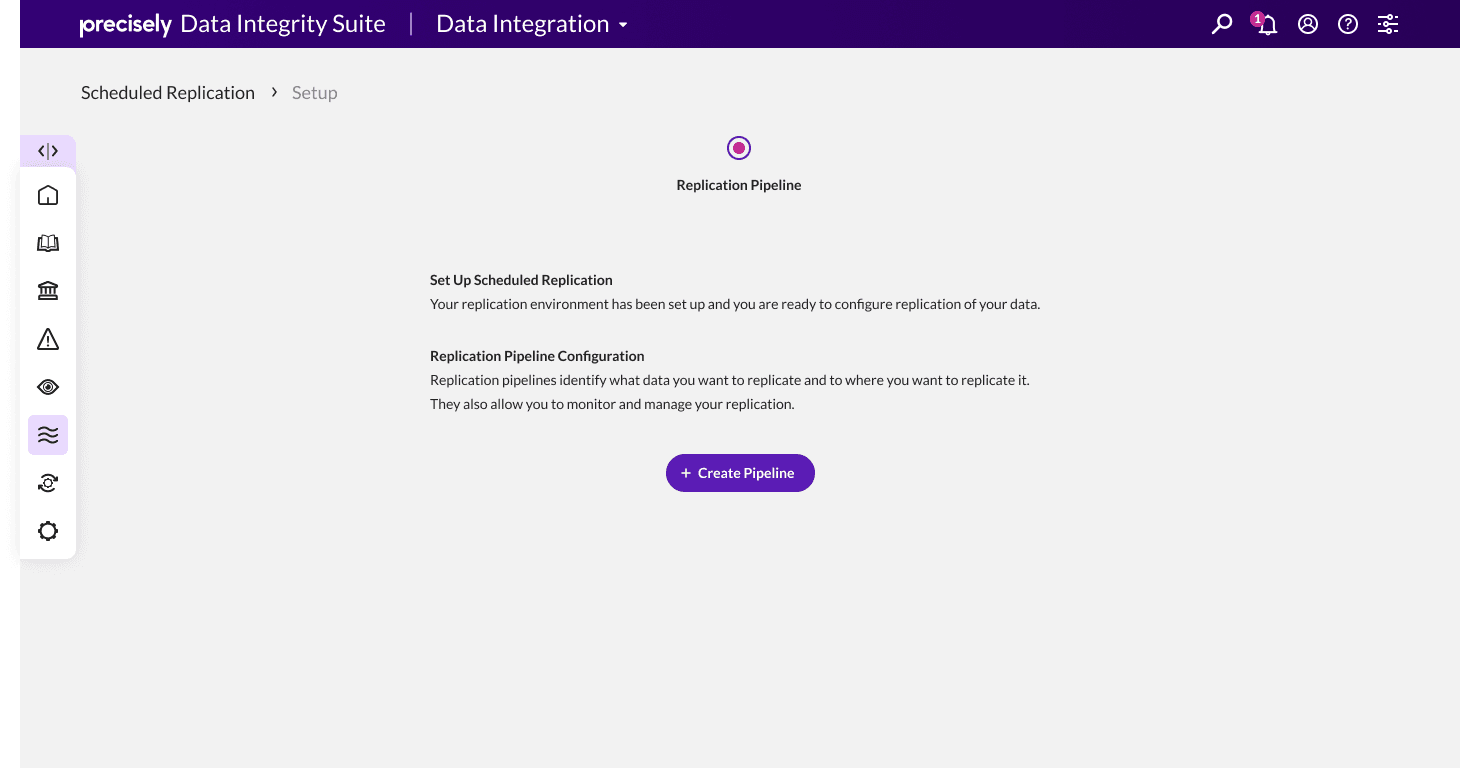
Currently, the first time the DI module is used, a setup wizard is presented to help the user get an agent and runtime engine installed, registered, and working.
The first-time setup wizard will be changed to allow the user to select whether to initially set up a scheduled or continuous pipeline.
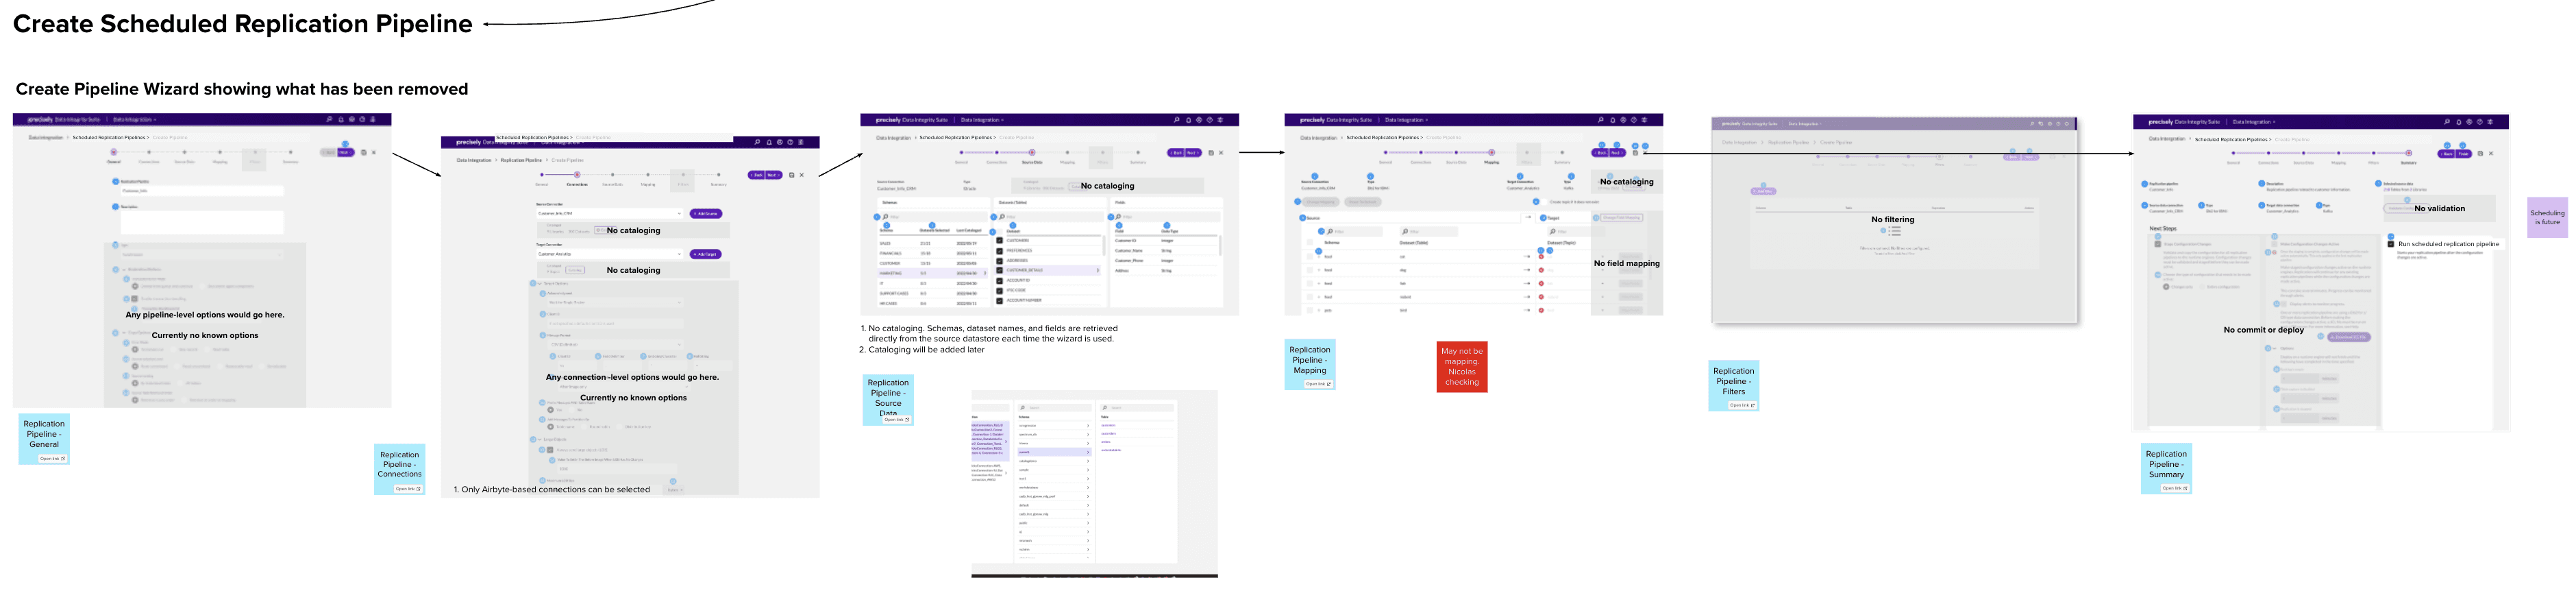
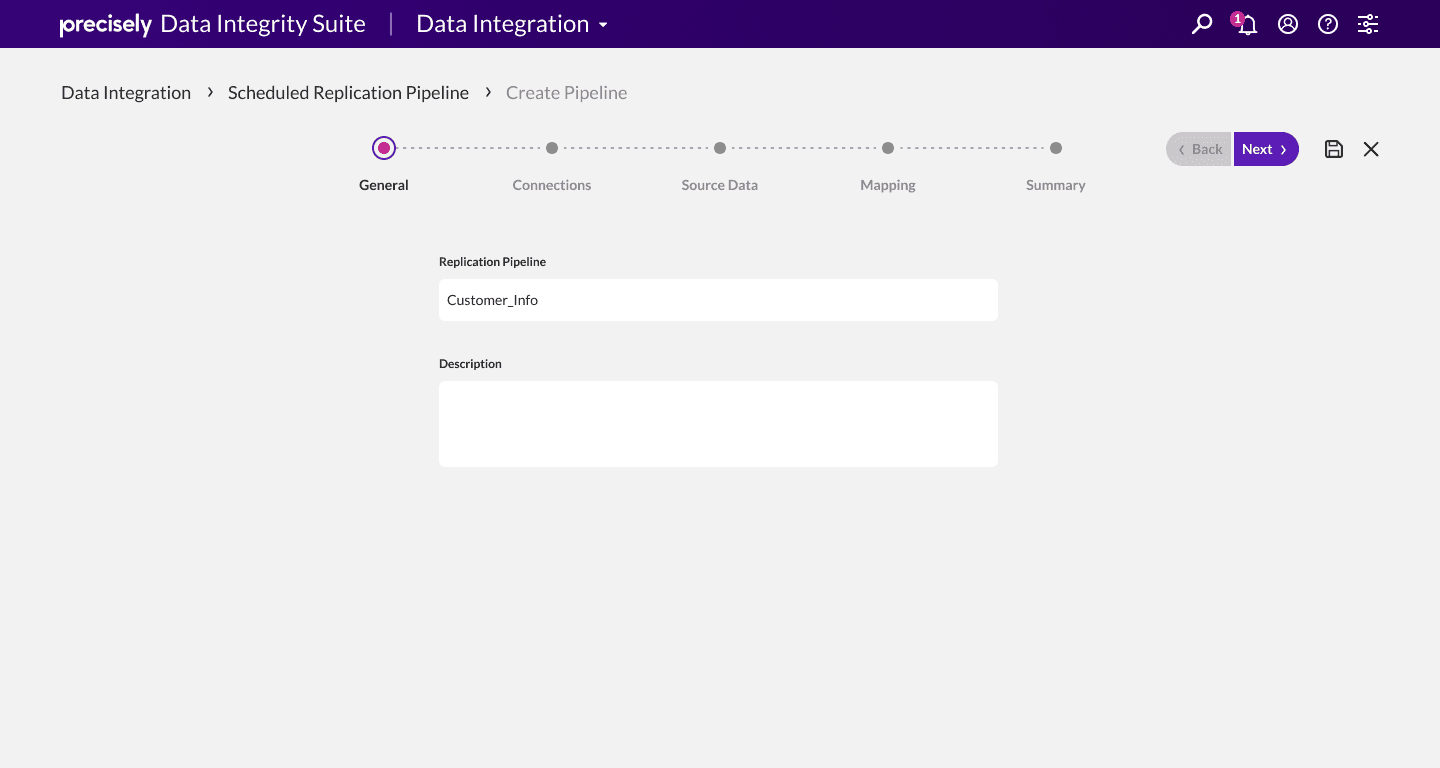
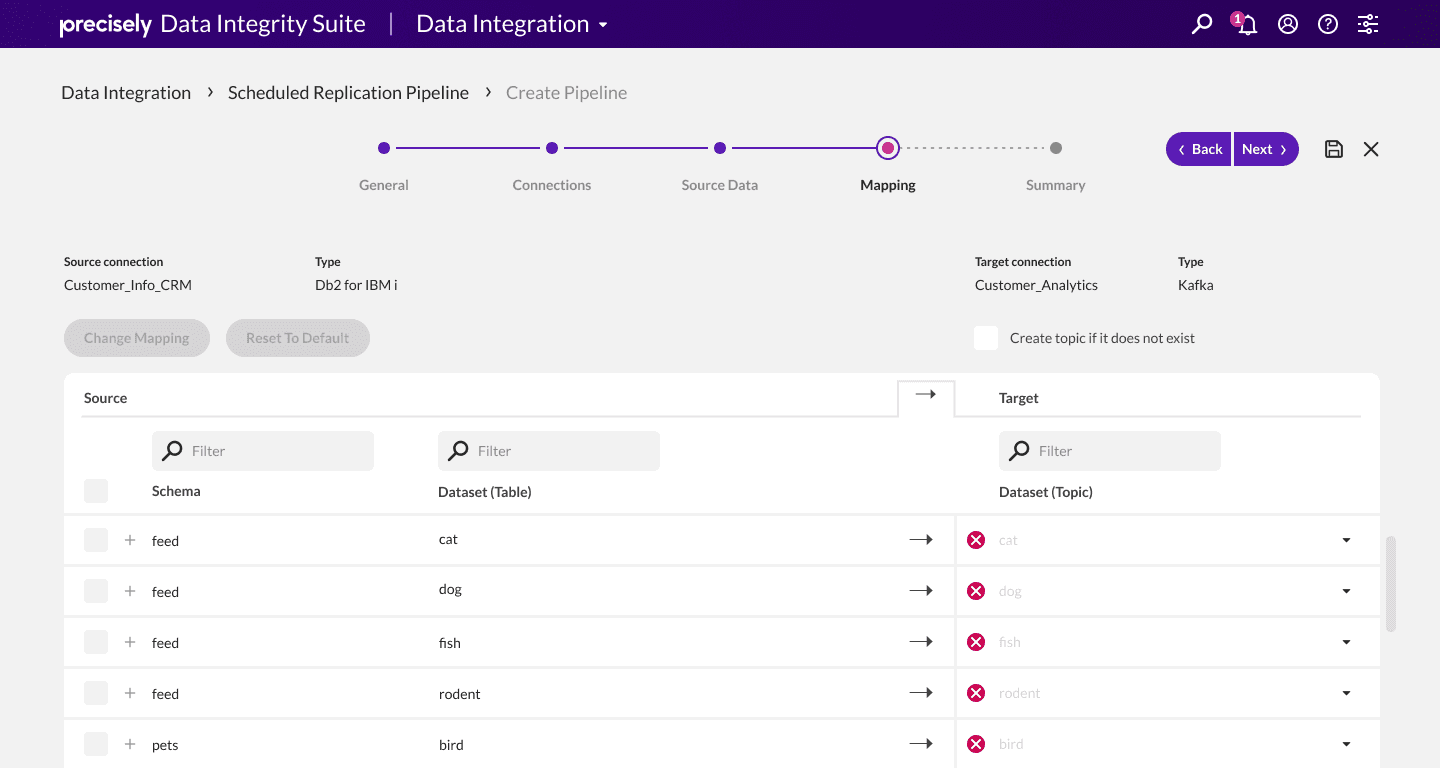
Scheduled Replication Pipeline Wizard for Create/Edit
Current replication pipeline wizard design with the following changes.
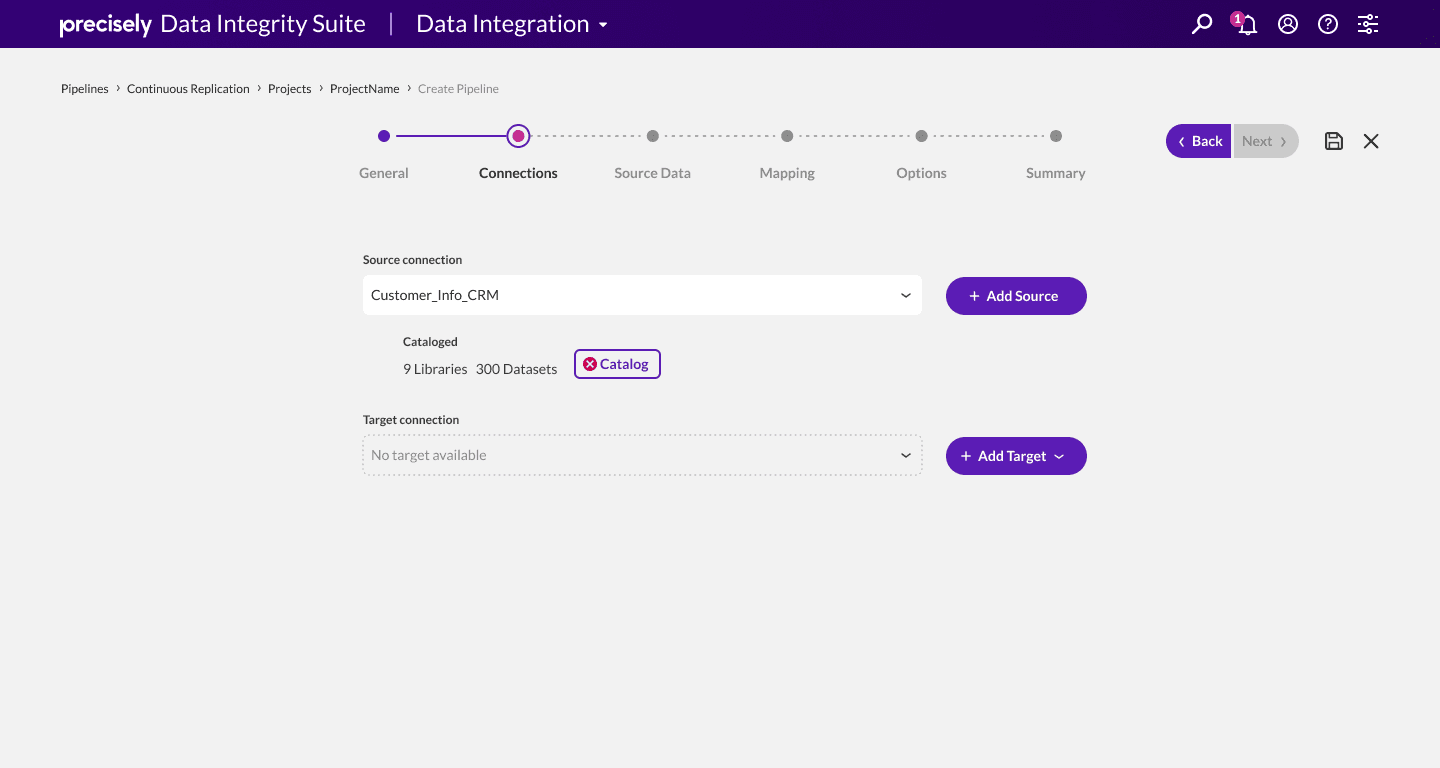
General

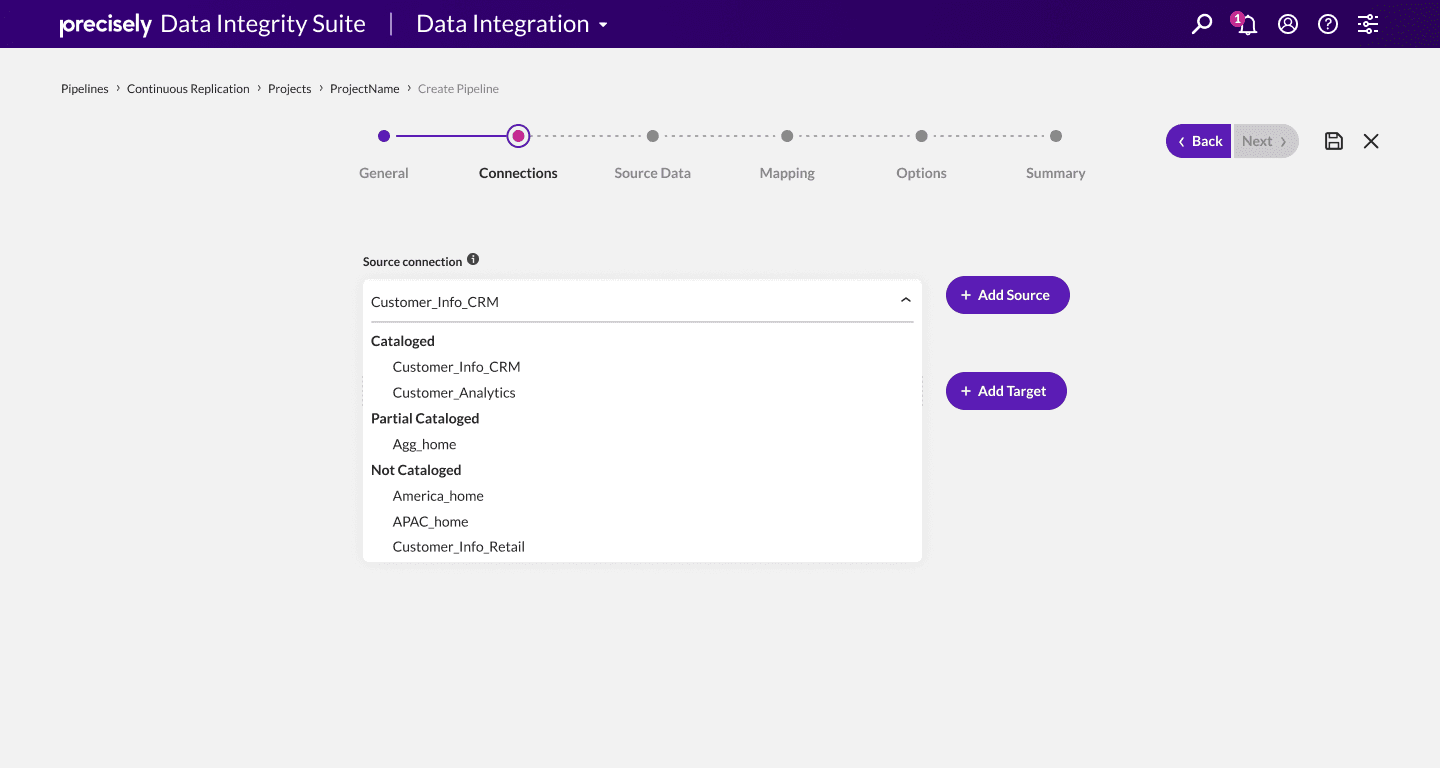
Connections
Only Airbyte-based connections can be selected.

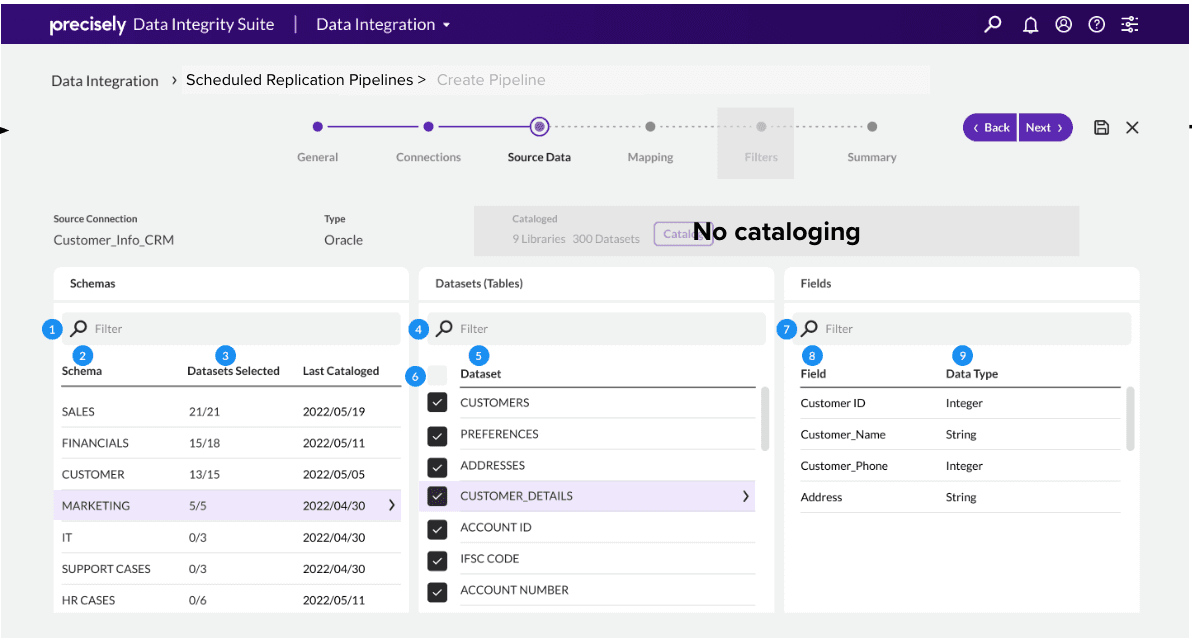
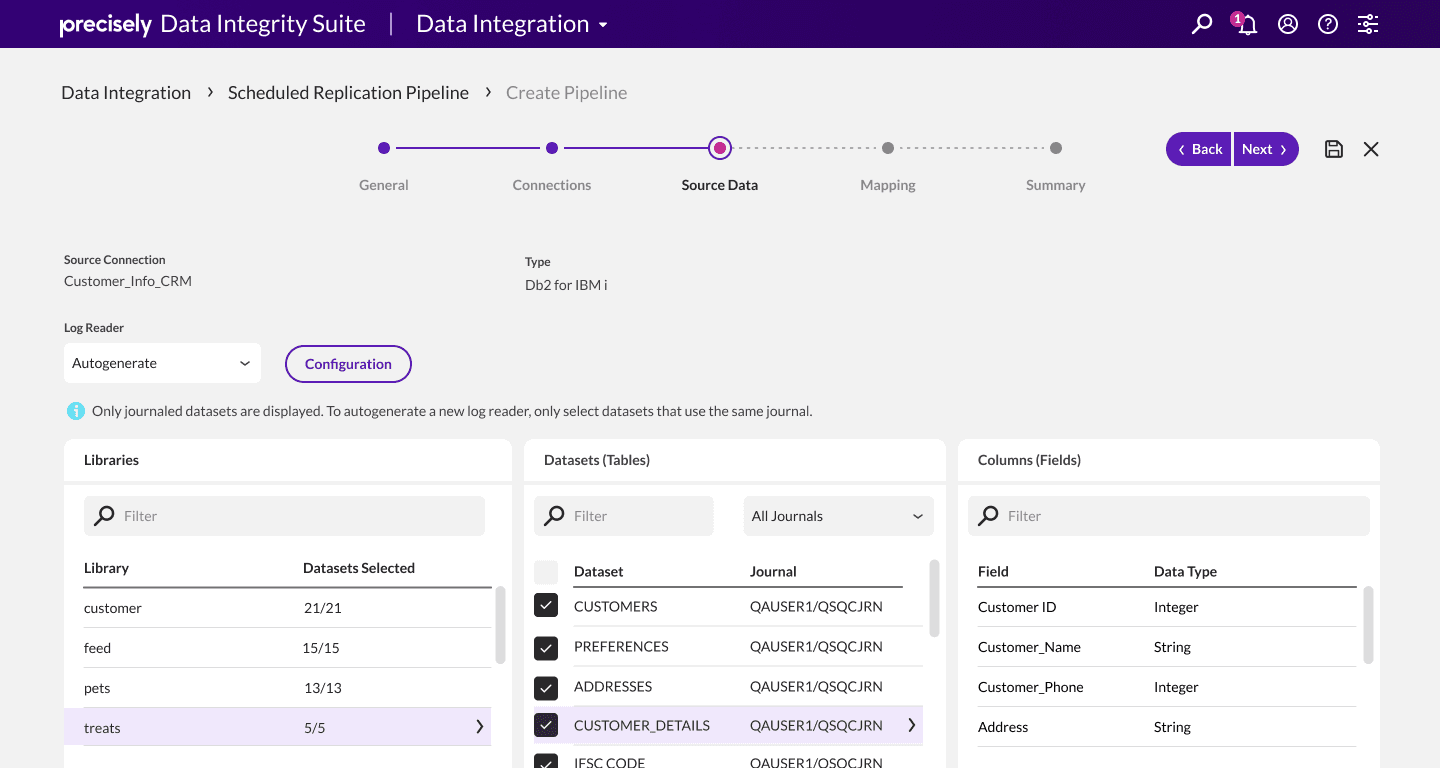
Source Data
No cataloging will be done for phase
Lists of schemas, datasets, and fields will be obtained directly from the connection.
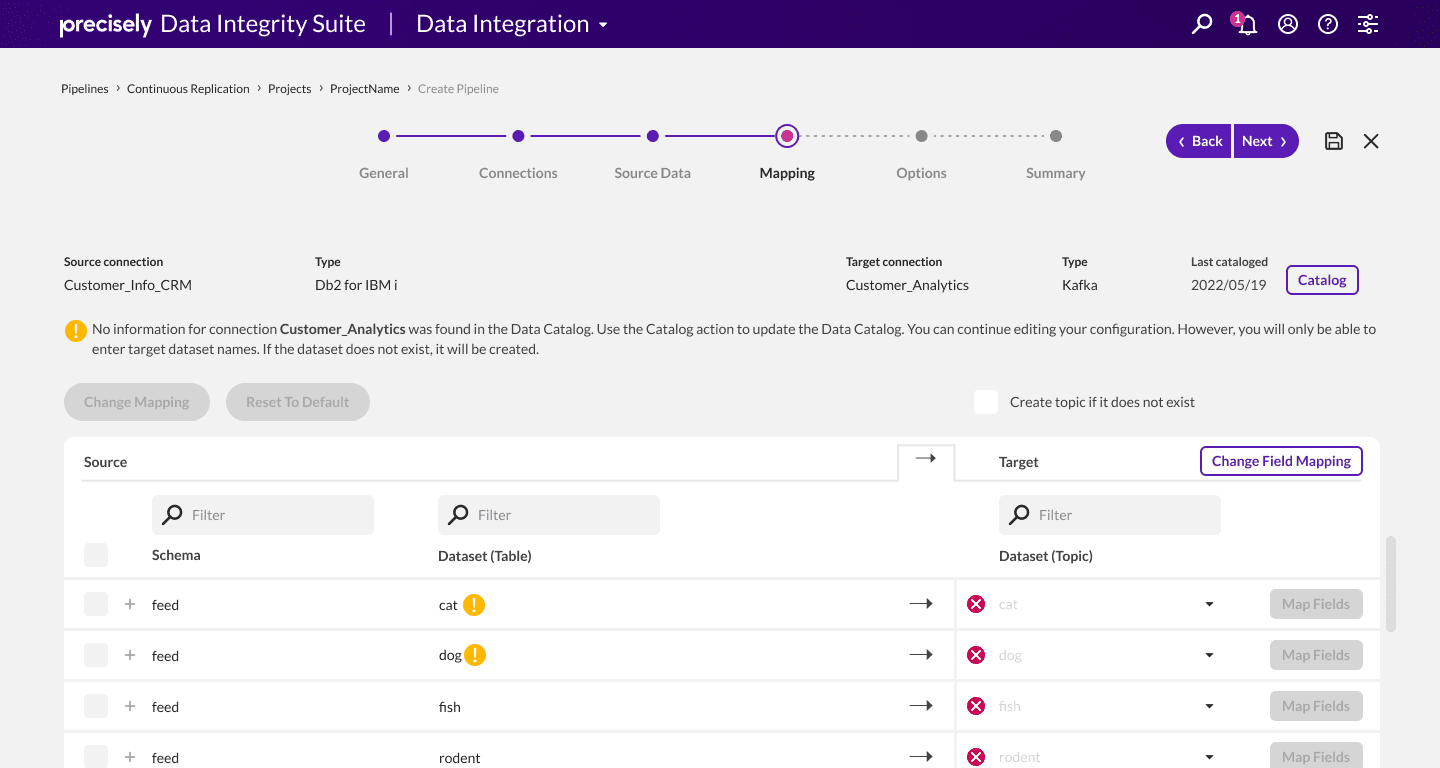
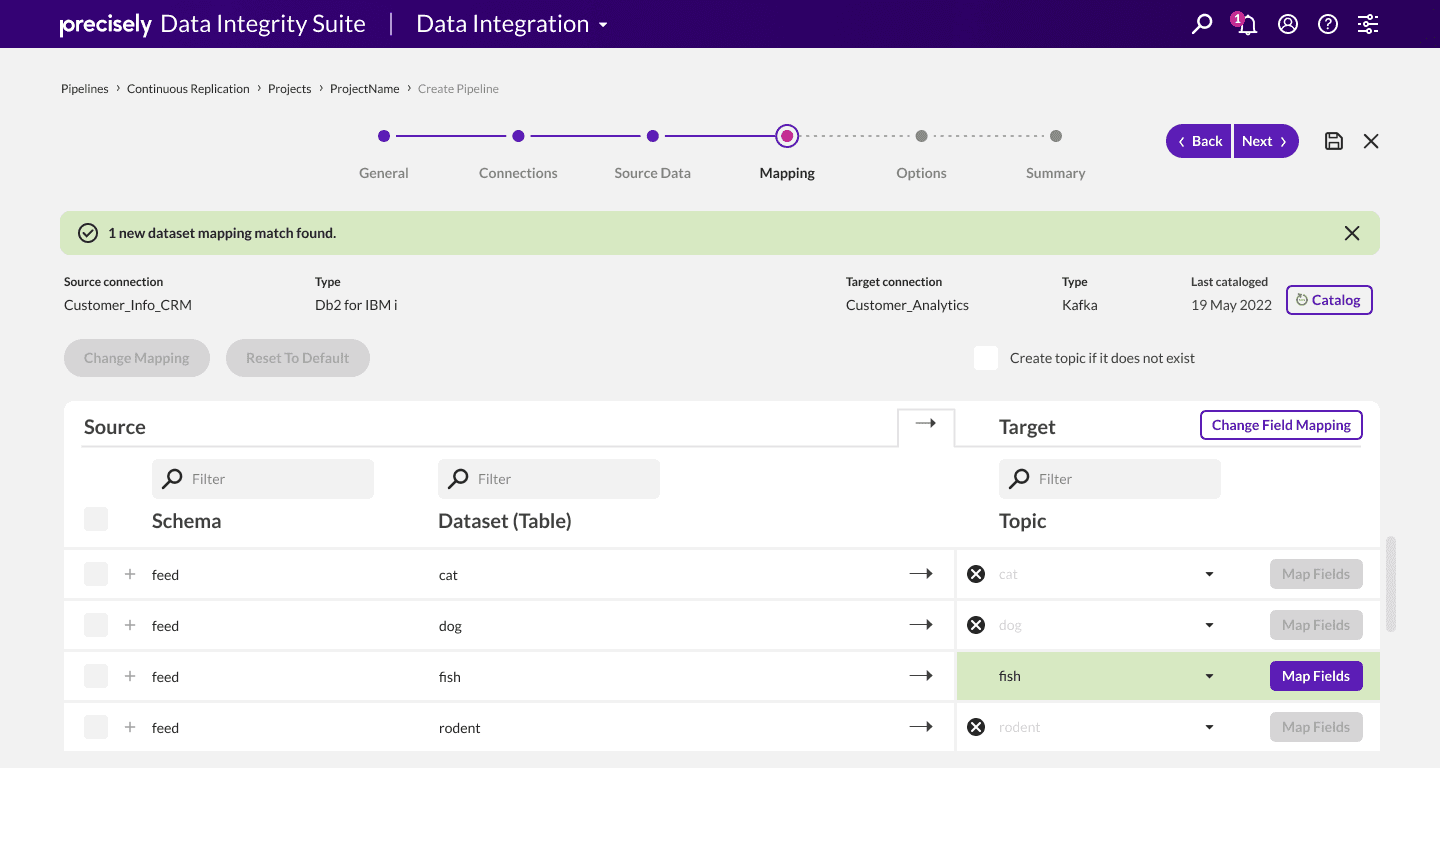
Mapping
Mapping is not currently planned for phase 1.
It will be added once we know what can be supported through Airbyte.

Filtering
Filtering is not part of phase 1.
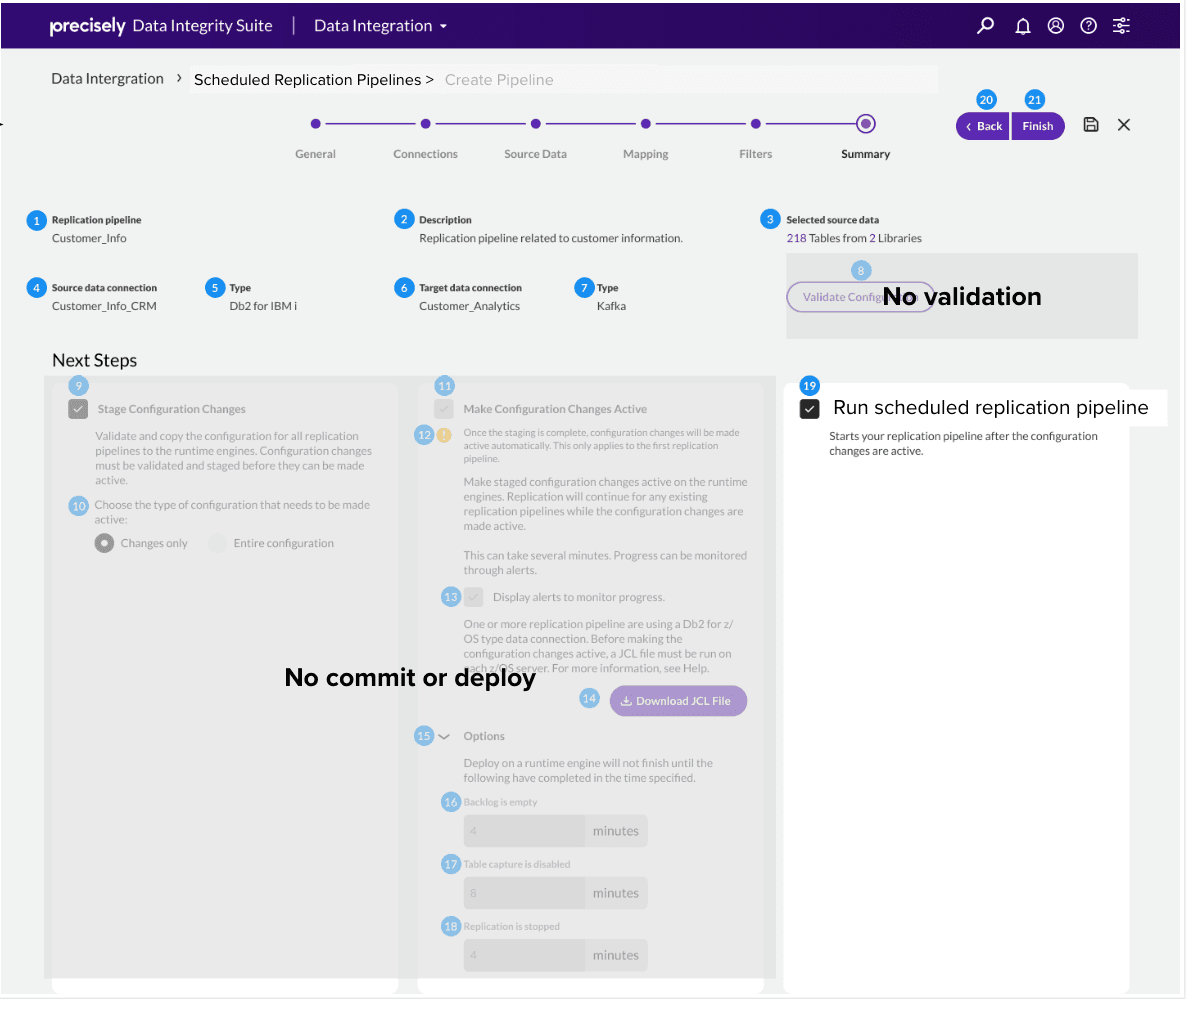
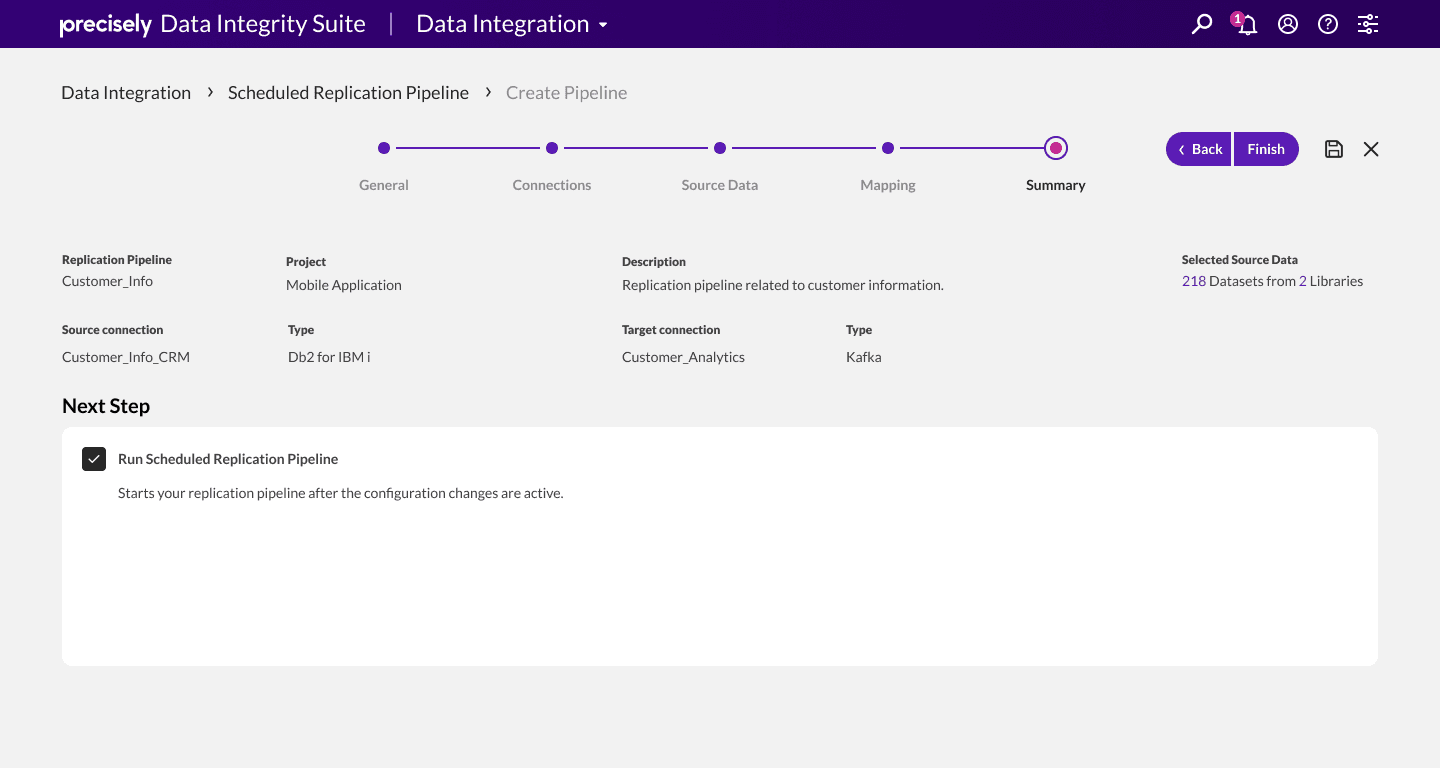
Summary
There is no concept of commit or deploy. Scheduled replication pipelines can be run immediately after they are created.
Changes made to a scheduled pipeline while it is running take effect the next time the pipeline is run.
Validation is not needed since values can only be specified through the wizard and can be validated as the user steps through the wizard.
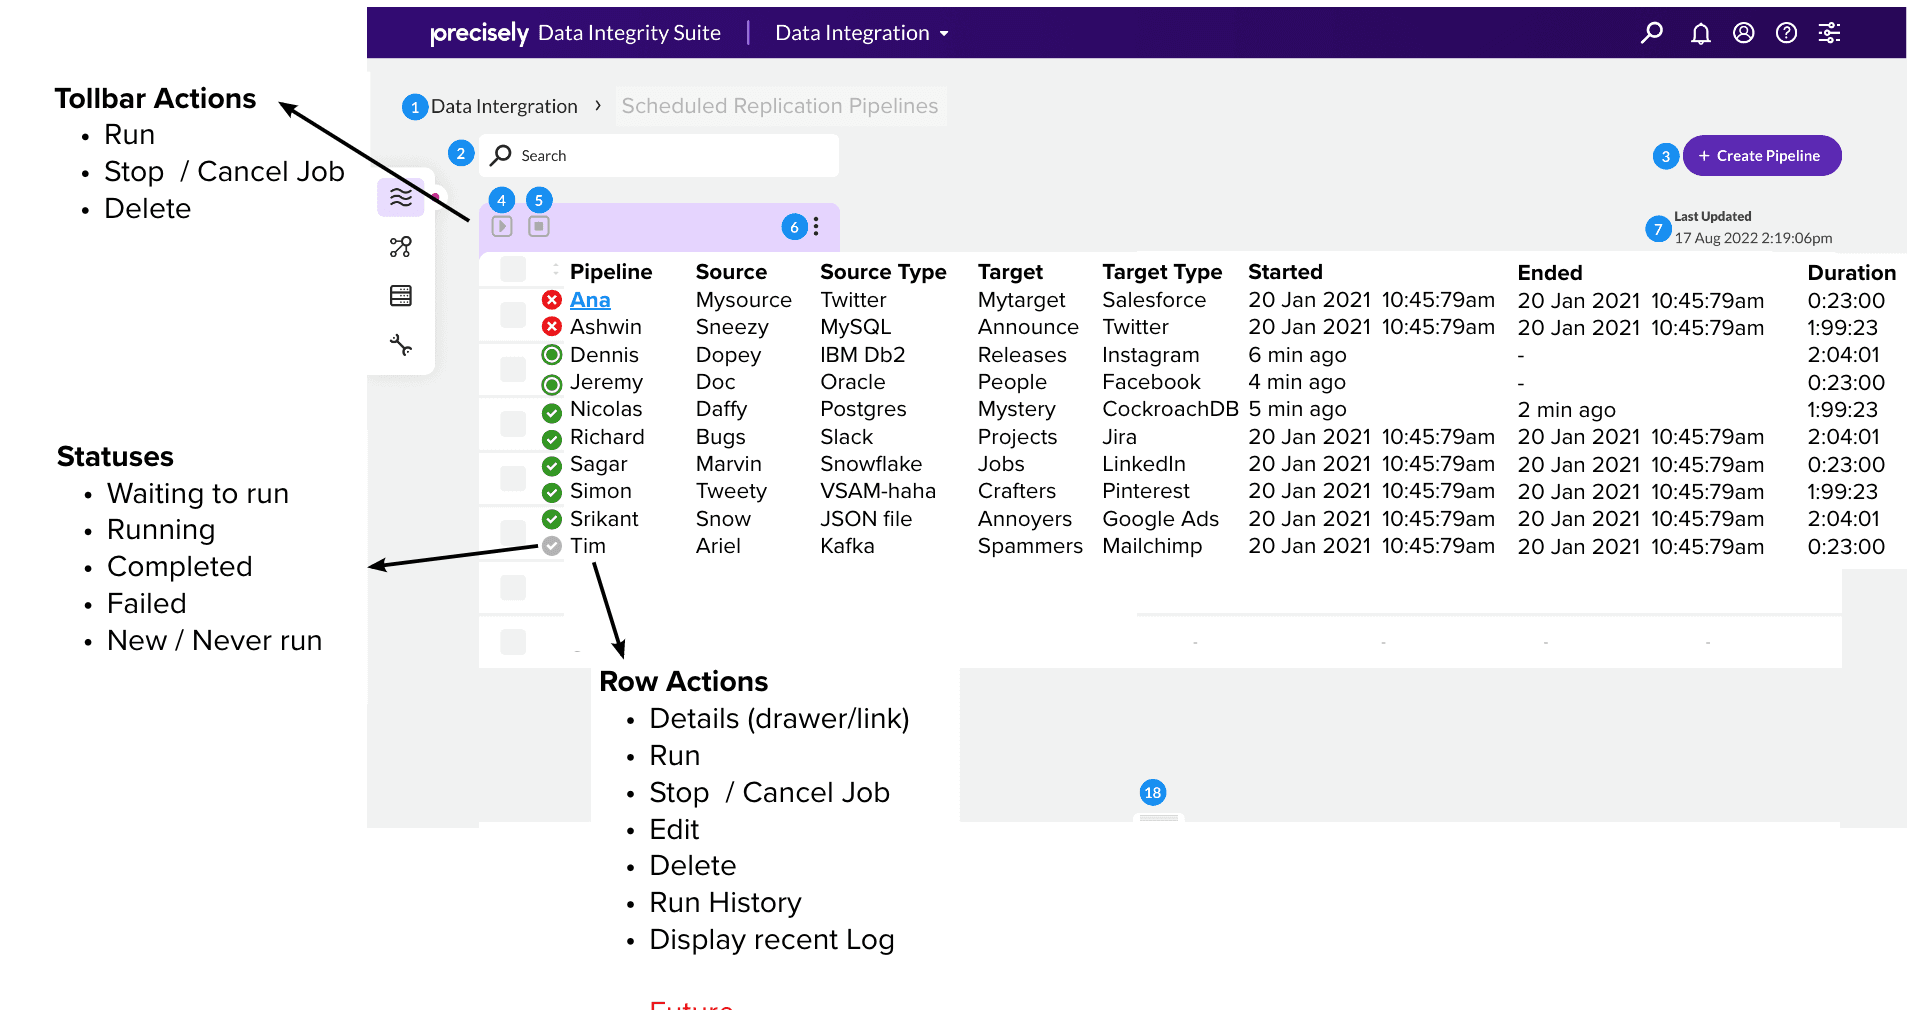
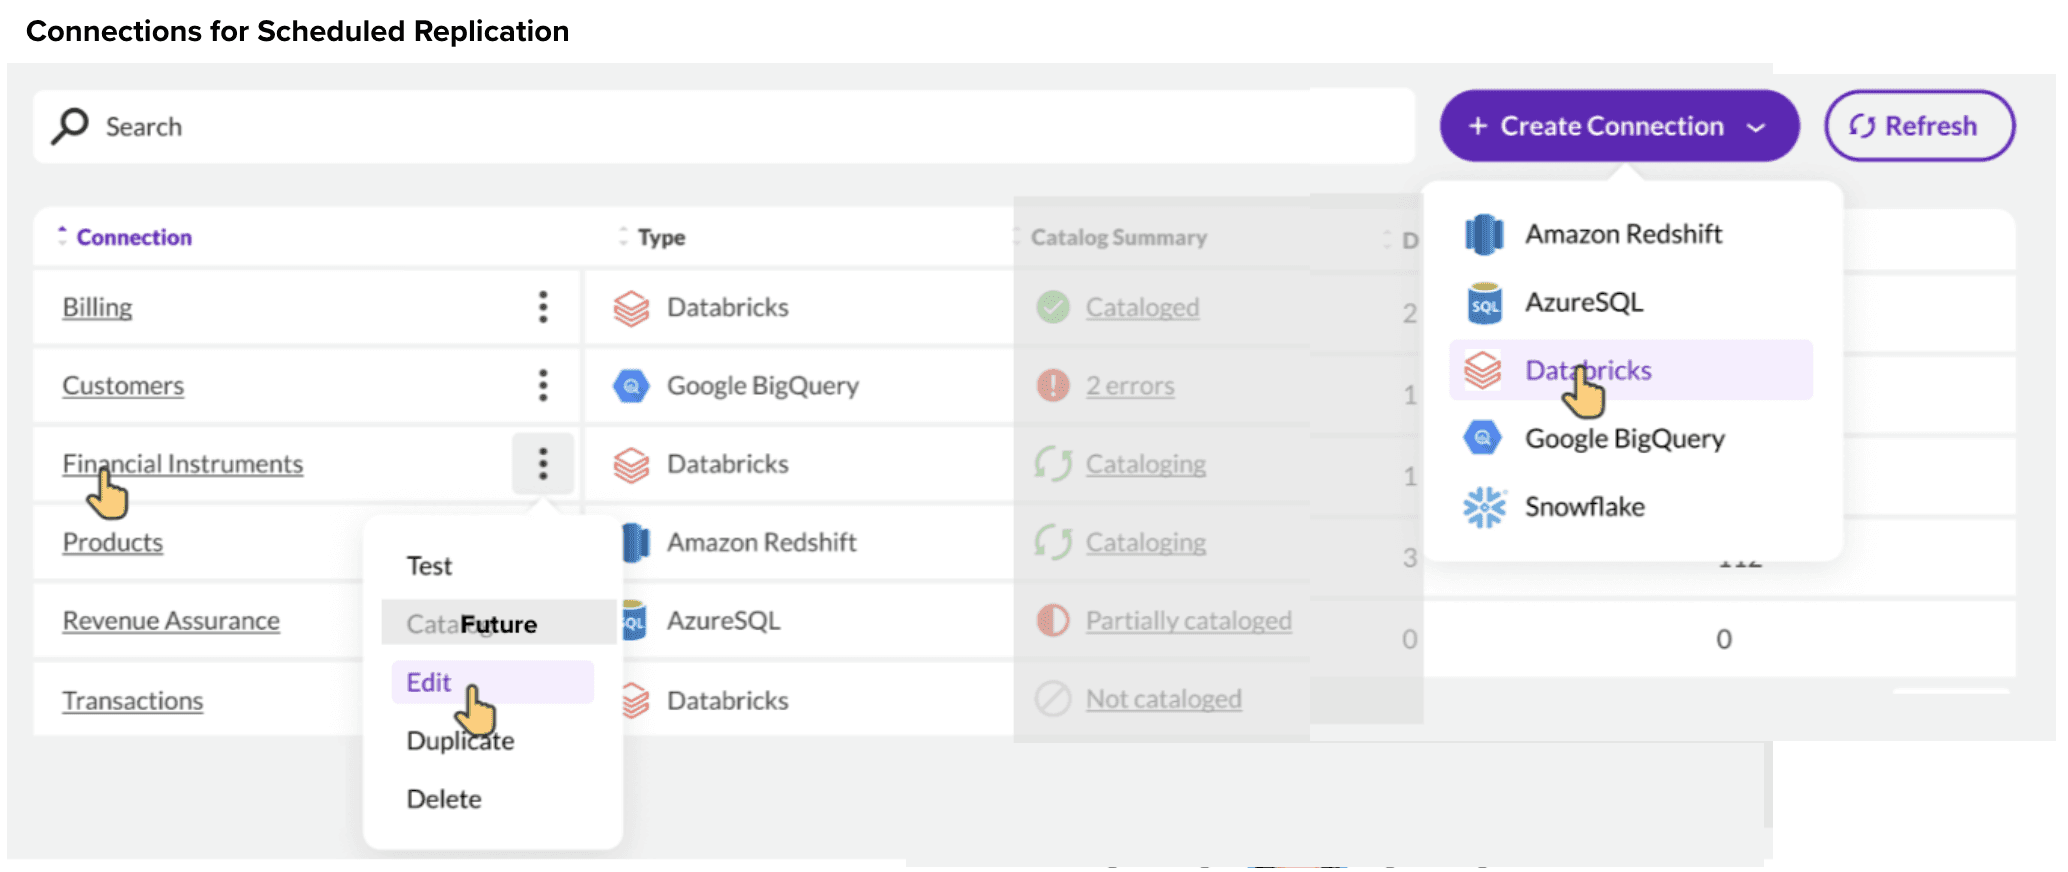
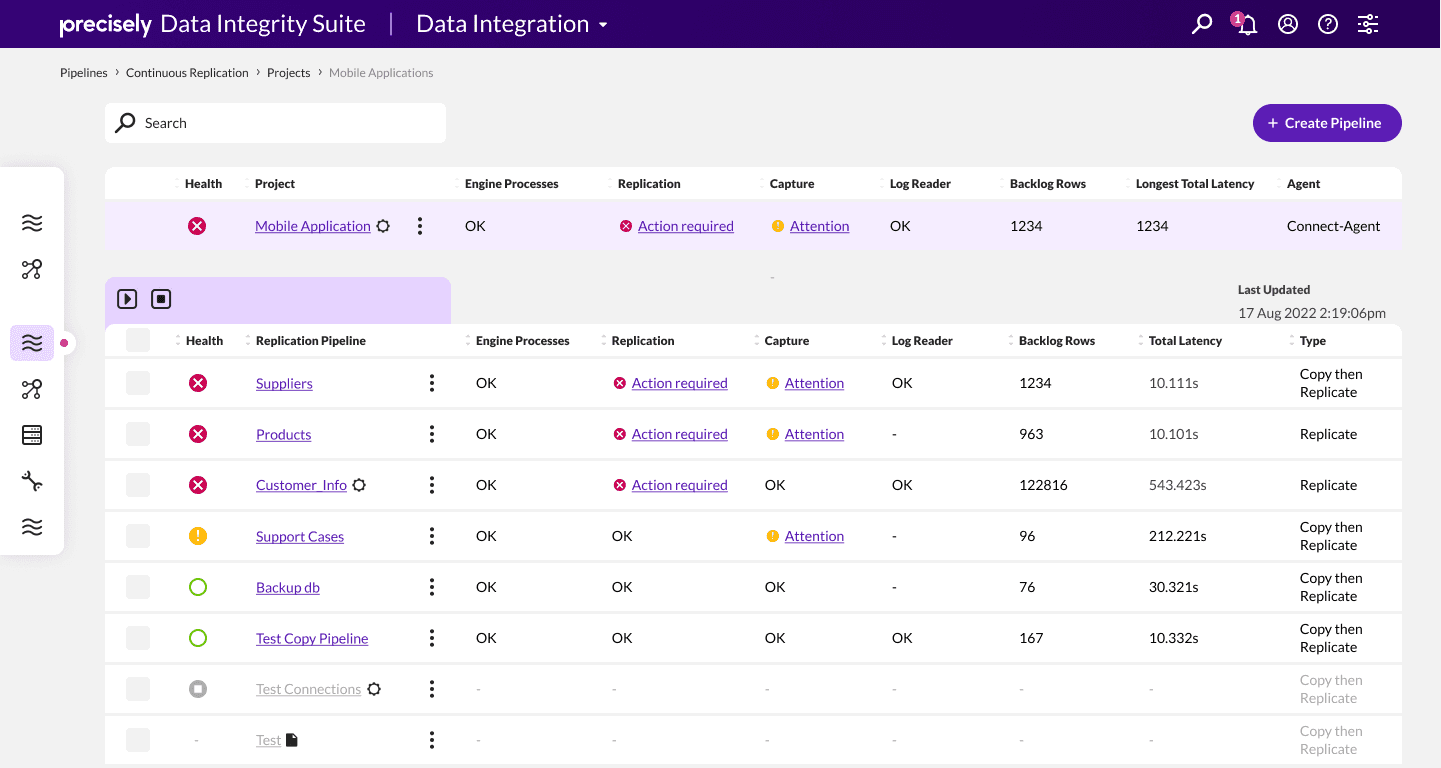
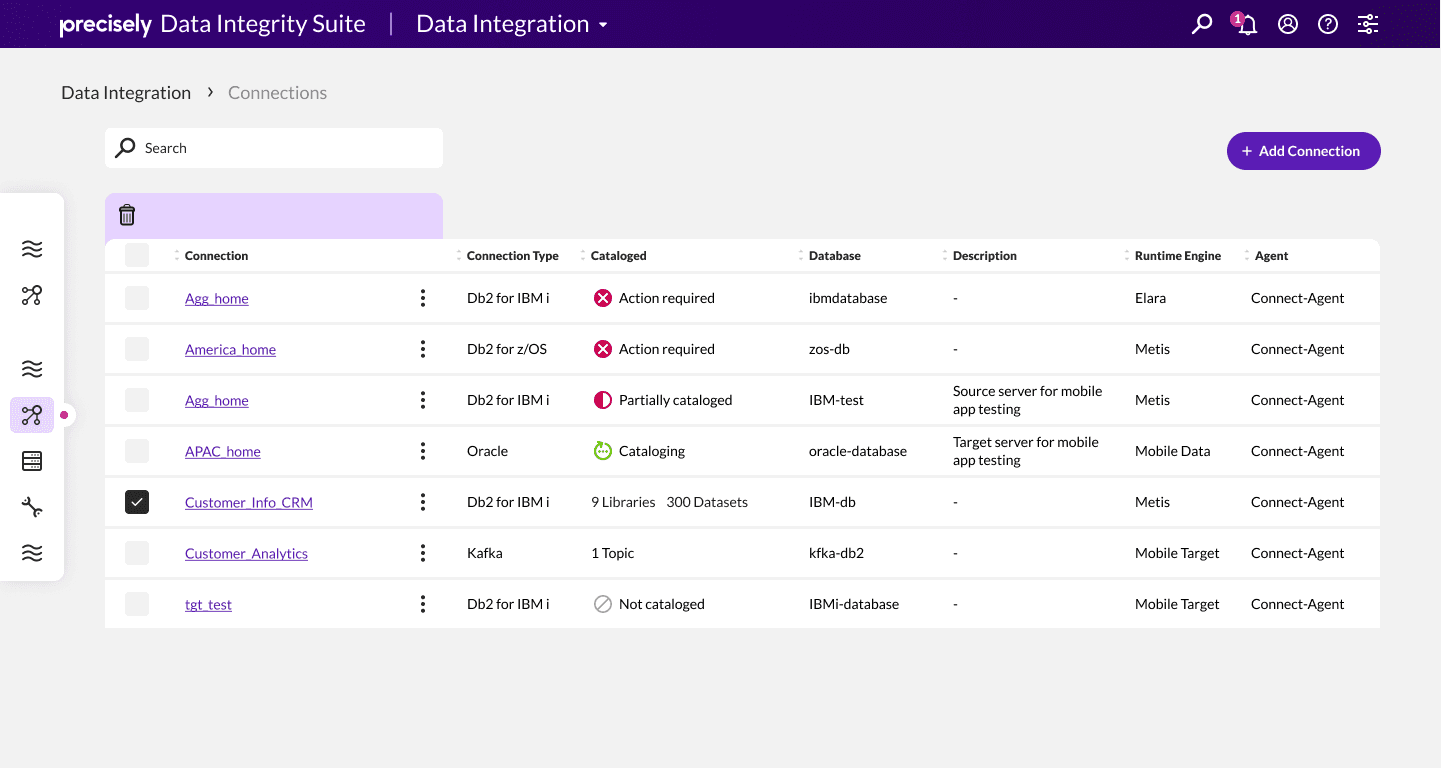
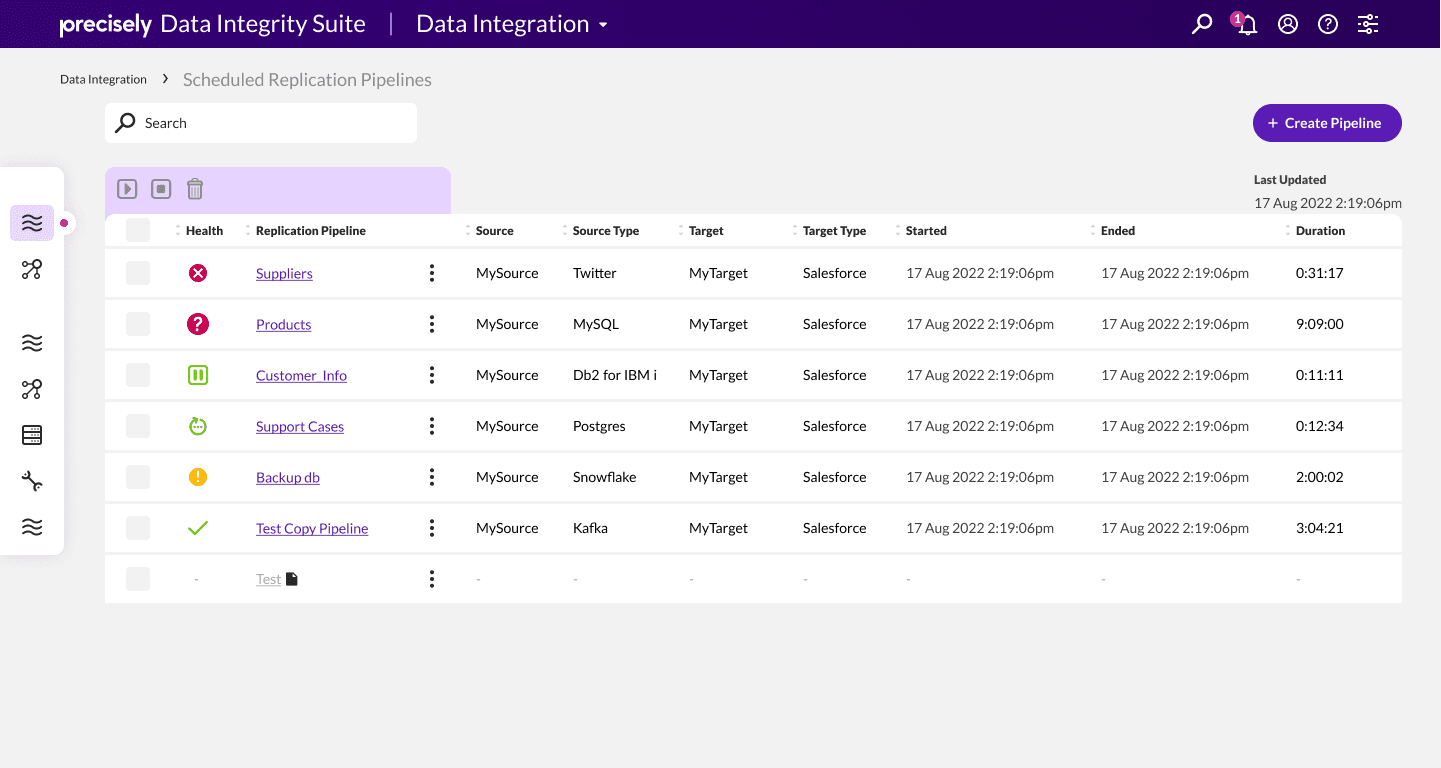
Managing Scheduled Replication Pipelines
The following shows the actions, columns, and statuses for managing this type of pipeline.
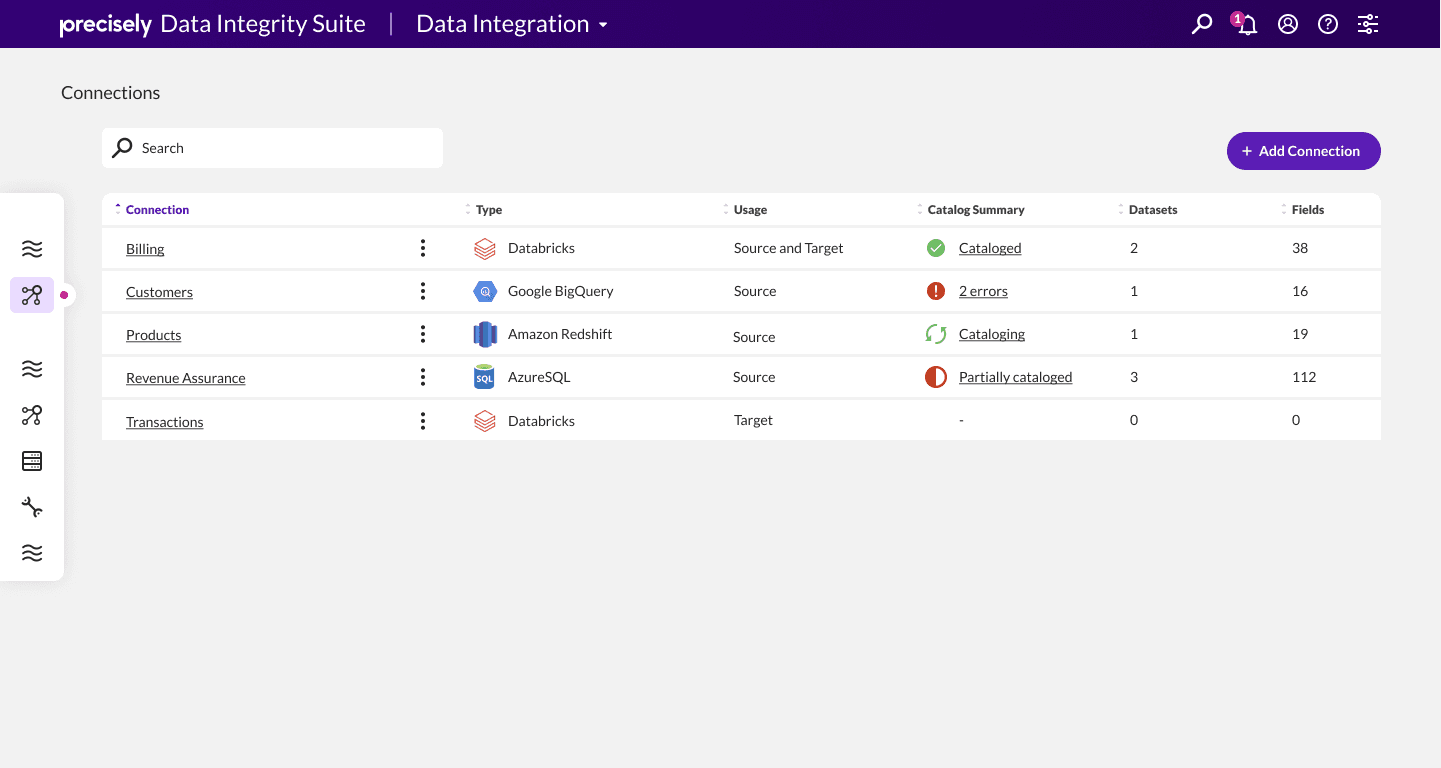
Connections List:
The list of connections will be similar to the strategic connections UI but will only contain Airbyte-based connection types.
Only Airbyte-based connections can be created and managed through this list.
See the Access Points section above.
Connection Properties
The UI for connection properties will be automatically generated based on the JSON that describes the connection properties.
Support
Display Log:
This will be the typical UI for displaying logs.
Run History (Future)
This will be a list that shows the log for each time a selected pipeline ran. It will have:
Columns such as:
Pipeline name
Timestamps of when the pipeline ran (started, ended)
Duration
Status of that run
Actions such as:
Display the log
Delete the log
Iterative Design Process
Refined designs based on internal feedback
Moved from wireframes to high-fidelity designs in Figma


Final Design
Developed comprehensive UI for Connect, including:
Pipeline creation wizard
Connection management
Pipeline management dashboard
Detailed pipeline configuration options
Prototype
Connect: Continuous Replication


Connect: Scheduled Replication

5. Team Leadership and Collaboration
Guiding the Team
Led the UX team through the discovery and research phase
Facilitated collaborative design sessions
Cross-functional Collaboration
Worked closely with Project Manager and Technical Architect
Ensured alignment between UX design and technical requirements
Mentorship and Skill Development
Guided the UX Designer through the project process
Encouraged knowledge sharing within the team
6. Impact and Results
User Feedback
Positive reception to the new pipeline creation and management interface
Improved ease of configuration for scheduled replication pipelines
Pipeline setup time decreased by 60%, from an average of 2 hours to 48 minutes.
Within the first three months of launch, 78% of eligible users had created at least one pipeline using the new interface.
Users were able to manage 3x more pipelines on average, increasing from 10 to 30 pipelines per user.
Business Outcomes
Successfully launched new features early 2023 on schedule and within scope
Enabled faster data integration setup for customers
Configuration errors decreased by 70%, leading to a 40% reduction in support tickets related to pipeline setup.
The number of successfully completed pipelines increased by 35% in the quarter following the launch.
The new drag-and-drop mapping feature was used in 75% of all pipeline configurations, indicating strong user preference for this method.
Net Promoter Score (NPS) for the Connect product increased from 32 to 58 within six months of the new feature launch.
Lessons Learned
Early collaboration between design and engineering teams proved effective
Agile methodology allowed for quick iterations and improvements
7. Reflection
Personal Growth
Enhanced skills in managing complex data integration UX projects
Improved ability to translate technical requirements into user-friendly designs
Challenges Overcome
Simplifying complex data pipeline concepts for a user-friendly interface
Balancing the needs of various user personas with different technical backgrounds
Leadership Skills Demonstrated
Strategic thinking in UX architecture planning
Team management throughout the design and development process
Stakeholder communication, ensuring alignment with business goals
Business acumen in understanding and addressing key pain points in data integration
Conclusion
The Connect project significantly improved the user experience for managing and configuring data integration pipelines. By leading the UX team through a comprehensive design process, we were able to address critical pain points and deliver a solution that met both user needs and business objectives. This project showcased my ability to manage complex UX challenges in the data integration sector, collaborate across functions, and deliver impactful results that streamline data management processes for our clients.


